
Data Insight
Data Insight is used to do the DHA (Data Health Assessment)on the data,to see if the data is good
to use. We use the tool data Insight to do a test / profiling on the data before we use the data for
the ETL process. We can also say that Insight is used to do the data investigation for DHA.
It automates the Analysis and Monitors the data.Using Data Insight we can perform following tasks
to use. We use the tool data Insight to do a test / profiling on the data before we use the data for
the ETL process. We can also say that Insight is used to do the data investigation for DHA.
It automates the Analysis and Monitors the data.Using Data Insight we can perform following tasks
- Data Profiling
- Column query
- Integrity test and Custom query
- Scheduling
- Creating a trend reports
- Sampling reports
- Getting started
- Creating Connection
- Navigation to data Insight
Note:- First we need to start the Data insight Engine before we use the tool.
To start the Data Insight Engine, follow the bellow navigation.
Start → Program Files → Business objects XI 3.0→Business objects Data Insight→Data Insight Engine
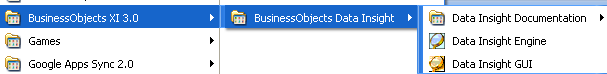
Once you click on this, a Dos window will open and it will start the engine.
Once the Engine starts, go for the Data Insight GUI in the same above navigation.
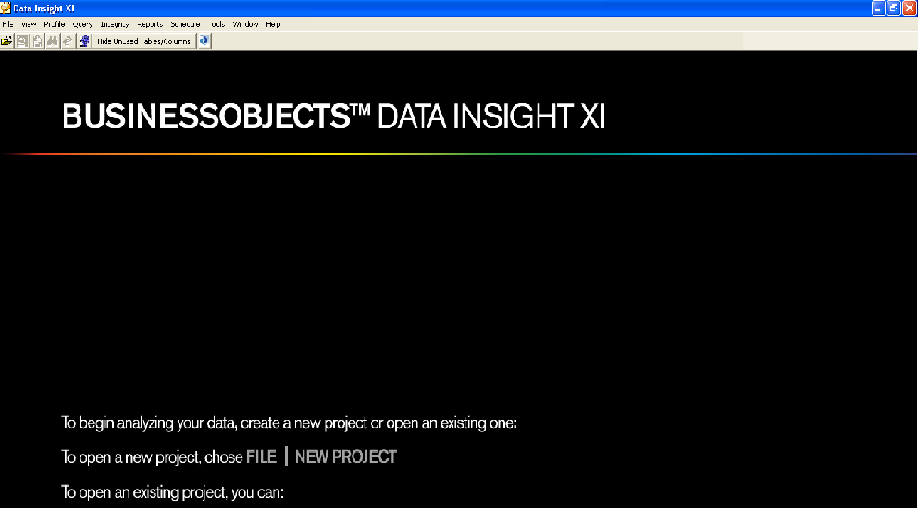
Once your Data Insight starts, You will find the bellow screen.
Now we need to create a Project
To create a Project go to the navigation
File-> New Project -> Give the project name and Check the box for Share Project.

By sharing, we can make it accessible to the rest.
Now you have to provide the connection name.
Choose Data base and click on the Down arrow to specify the database connection.

If using for the first time, give your SQL server name and click on OK, it opens the data link
properties window. Give in the server name and username and password.
In step 3 select your SQL database on which you want to perform the test.
Click on Test connection to see if the credentials are correct. And click on OK.

Now it will open the below window for selecting Owners. You can click on OK.
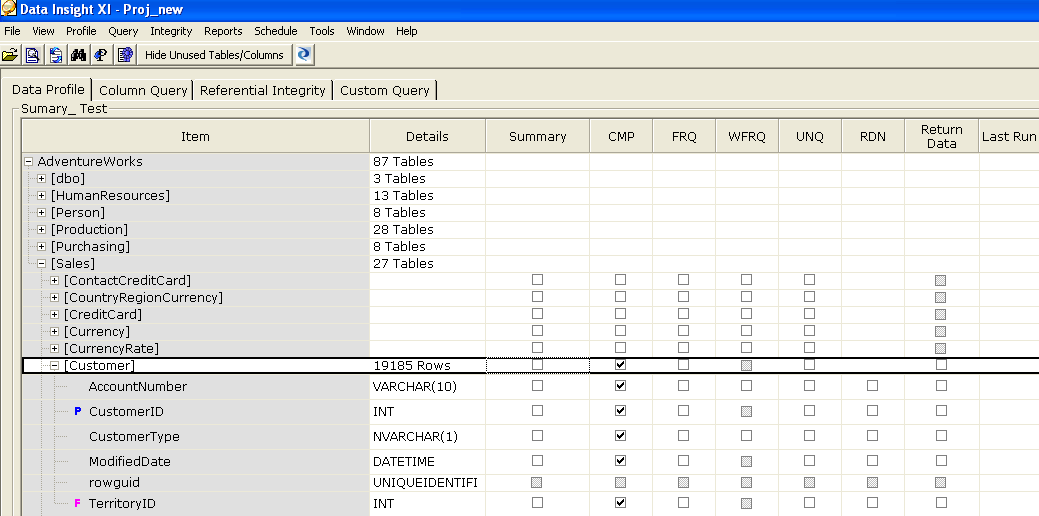
Now the Insight Window is open and you can see the selected DB available.
Expand the data base to see the tables under it. Go to the selected table and expand it.
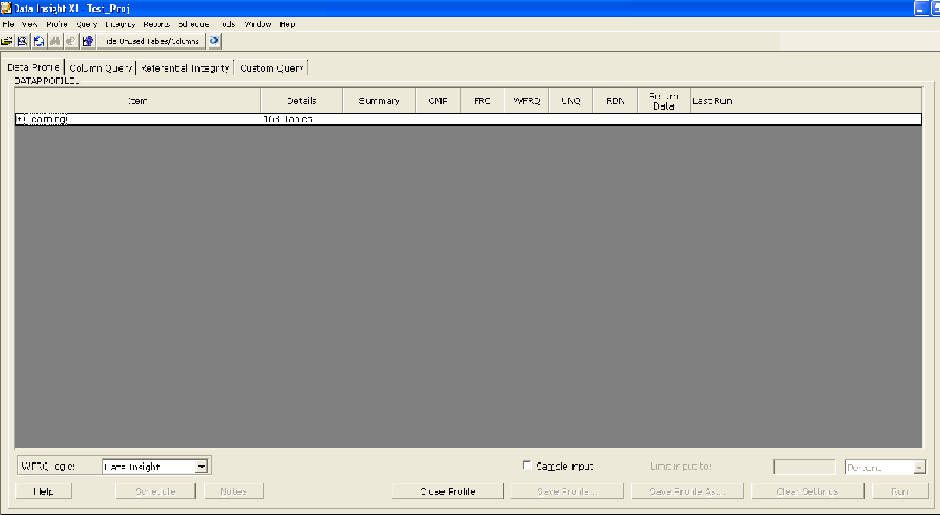

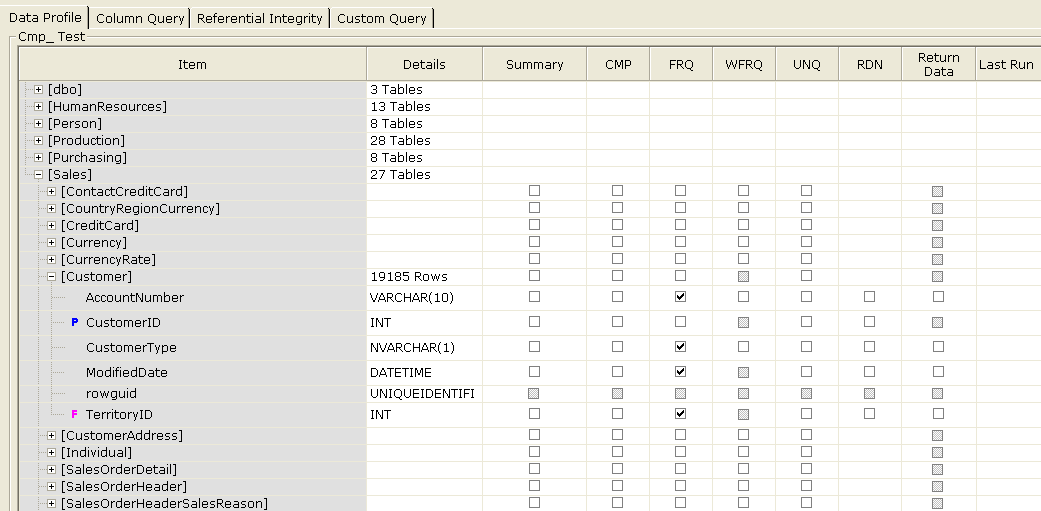
Here we have 4 tabs (Data Profile, Column Query, Referential Integrity, Custom Query) using which
we can perform different types of tests on the data.
we can perform different types of tests on the data.
Data Profile
Using this we can perform tests like Summary on the data, Comparison, Frequency Test,
Word Frequency test, Uniqueness of data, Redundancy test.
Word Frequency test, Uniqueness of data, Redundancy test.
Summary will give the snap shot of the data for decision making or further drilldown.
How can we carry out the Summary test?
You can perform the summary on the table level or on a column level as well.
Select the Check box under the Summary column and click on RUN.
Select the Check box under the Summary column and click on RUN.
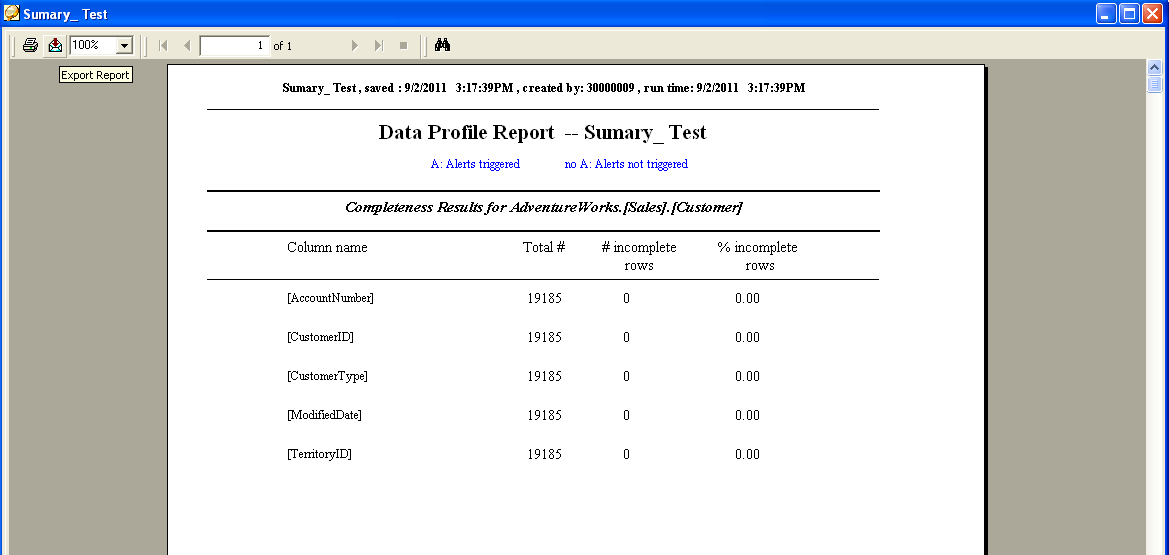
It will give you the below Summary Profile on the data which gives a complete DHA on the data.
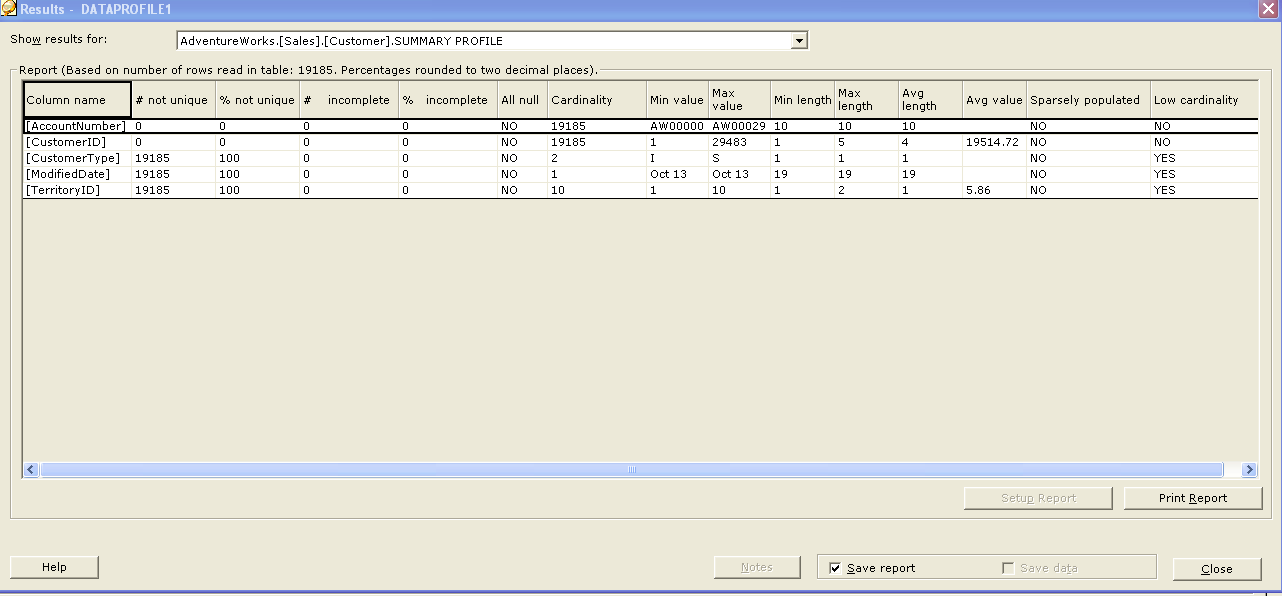
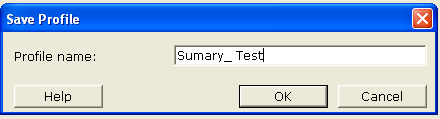
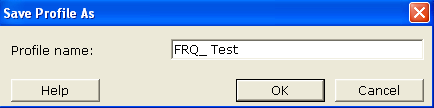
You can check on Save report and click on close. Now it will ask you to save the profiler report.
Click on Yes and give the Profiler name and click on OK.

Now if you notice, the last run column is populated with the time stamp and the result.
Click on the result next to the time stamp to see the results.
Comparison test
Comparison is used to get the report of Count & percentages of rows with incomplete column values.
To do a comparison test, Click on the check box under comparison at the table level or the row level
and click on RUN.
and click on RUN.
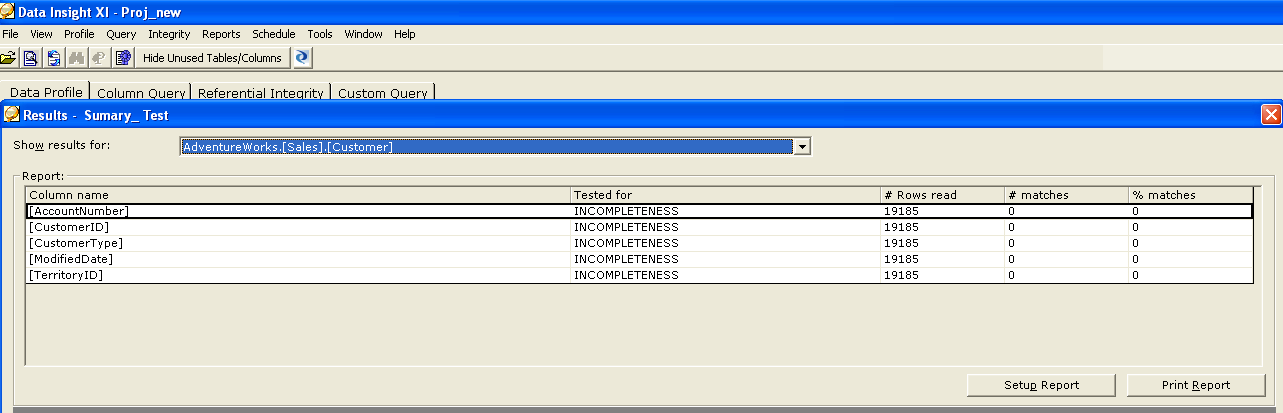
Now you can observe the result and it gives the result of the match or duplicates records available.
In our case we don’t have duplicates or match records.
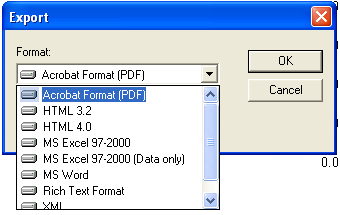 You can also click on print report to generate the report and also can export the report to different
formats by clicking on the export report.
Once you close this report and click on close in the main window, it will ask you to save the result and
same as the above procedure we can save the results.
same as the above procedure we can save the results.
Frequency (FRQ) is used to find the frequency distribution of distinct values in columns.
The working procedure is same as the above. Click on the check box under the FRQ and click on RUN
to see the results.
You can also click on print report to export it in to different formats.
You can also save the result by checking save report and click on close and give the profiler name.
to see the results.
You can also click on print report to export it in to different formats.
You can also save the result by checking save report and click on close and give the profiler name.
Please see the following screen shots.

WFRQ (Word frequency )Frequency distribution of single word.
Same as the above procedure, click on check box and click on run to see the results.
UNQ (Unique) This gives the count & percentages of rows with non-unique column values.
Same as the above procedure, click on check box and click on run to see the results.
RDN (Redundancy ) This test is to identify the commonalities & outliers between columns.
Same as the above procedure, click on check box and click on run to see the results.
Column Query :- This is used to Analyze the data within the Data Insight.
Select column on which you want to perform the test and right click → add combined column query

We can perform the following test using the Combined column Query.
Format
Occurrence - Search for the occurrence (<, >, =,<=, >=) ‘n’ times
Pattern - Pattern of the data in the column
Pattern recognition - Recognizing the string pattern with special chars
Range - specify the min and max values for the range
Reference column - reference column on which we have to refer this column
Specific value - test Search the column with a specific value
Select the Radio buttons on left side and the respective selections will be activated on the right side.
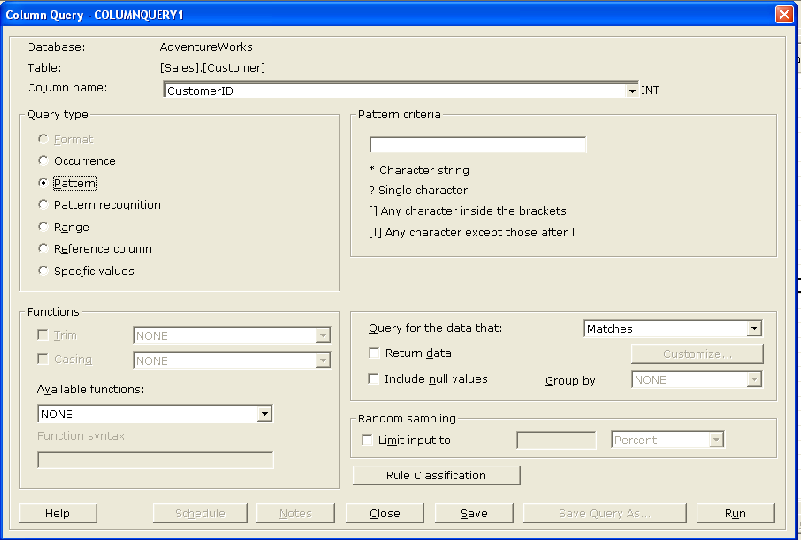
Once you select the query type on the left side, chose the respective options on the right side and
click on return data check box and click on run,In our example, we take the specific value test.
Select the specific values on left side and specify a value on the right hand side.
Select the Return data check box and click on run.
You will get the below result. You can click on print report to see the data in a report format,
or you can click the check box save data and click on close.
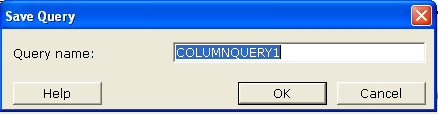
Click ok to save the repost and give the repost name and click on OK.
Select the Return data check box and click on run.
You will get the below result. You can click on print report to see the data in a report format,
or you can click the check box save data and click on close.
Click ok to save the repost and give the repost name and click on OK.
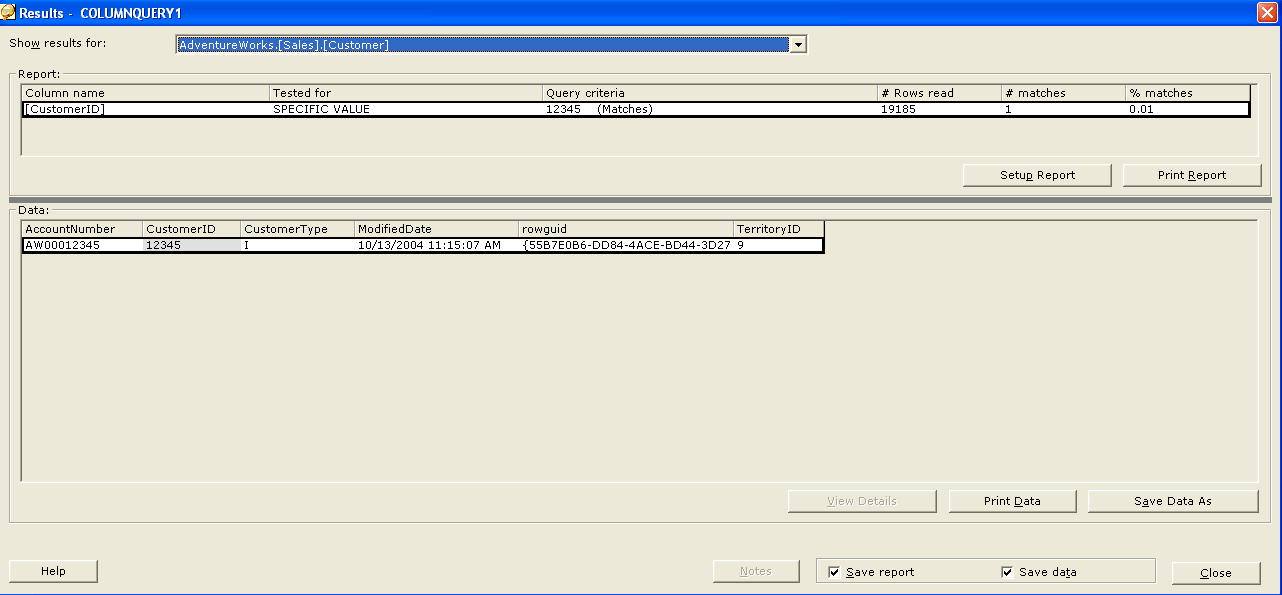

Now the COLUMNQUERY is generated and we can see the time stamp along with the result.
You can also click on the setup report to generate an Adhoc report. Click on Setup report
Give the chart title , select Chart as Graph and chart type as PIE.
Click on save and close and click on Print report to see the PIE chart as below.

You can also click on Export to export the report in to various formats like PDF or word.
Referential Integrity
Using this we can perform tests like (Uniqueness of data,Foreign key reference,Primarykey reference,
Primary key reference & Auto business rules).Also you can notice that on the left hand side when you
see the columns, it represents which is a primary key and which is a foreign key.
Primary key reference & Auto business rules).Also you can notice that on the left hand side when you
see the columns, it represents which is a primary key and which is a foreign key.
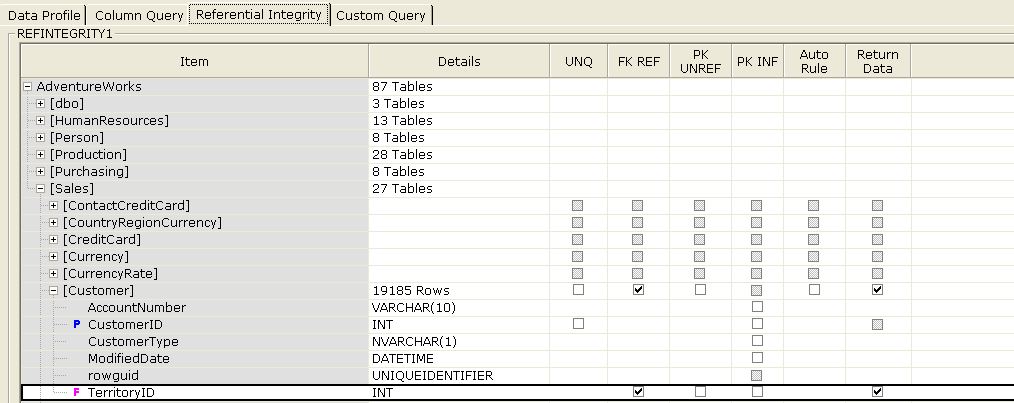
So in our example, we select the FK REF (foreign key reference) for the column
Territory ID and also click on Return Data and click on Run.

If you observe, since we have match records as ‘0’ we don’t have any records in the Data in part of
the screen. If we have any match records there, then the return data option will return those records.
Custom Query
User defined Query.
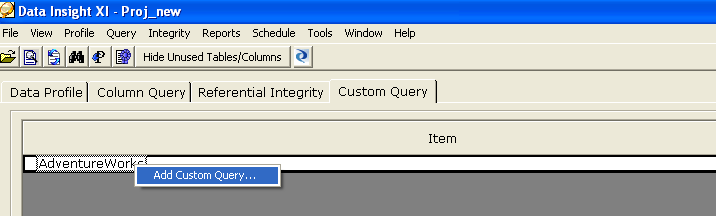
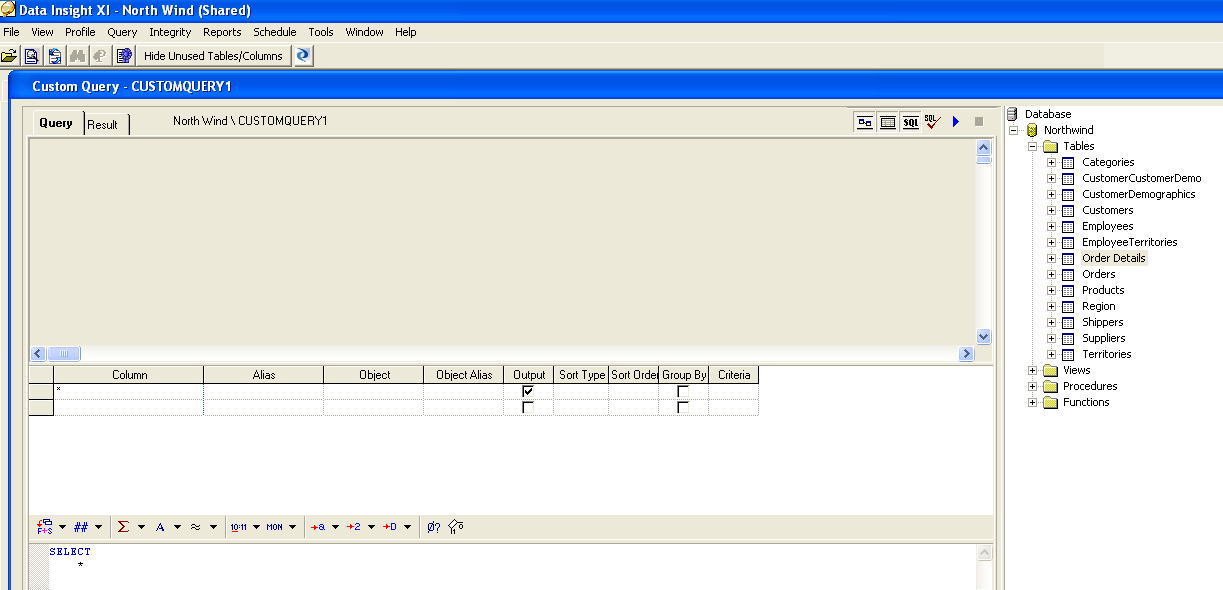 Go to the Custom Query tab , select the data base and right click and choose Add Custom Query and
 the below window opens. In our example here we will see the Report by joining the Orders table with
the Order details table.So expand the data base North wind & drag the Orders table under the query
and also Drag Order details table in to the query space. You can notice that both the tables are
automatically linked on the primary key basis and you can also find the SQL code that is generated at
the bottom. Click on RUN to see the result.

You can also write your custom query to get you specified output.
Scheduling these test in Data Insight.
We can schedule all the above tests to monitor the health of the data on a regular basis.
To schedule the repots, Go to the menu and select schedule→ Add batch.

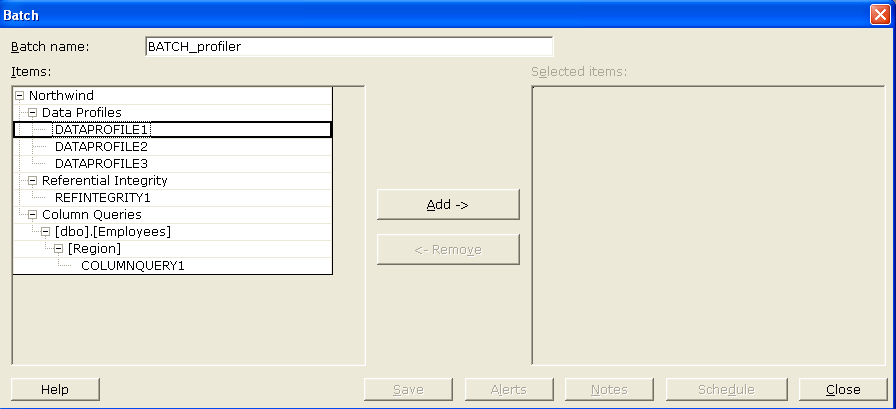
Give the batch name and expand the database to see the saved tests.
Select the test and click on ADD-> to add the repots to the selected items.
Once you add all or required repots for scheduling, click on save , schedule.

Select the name of the repot and choose recur once every option , end data and the start time.
Now click on ADD and click on close.
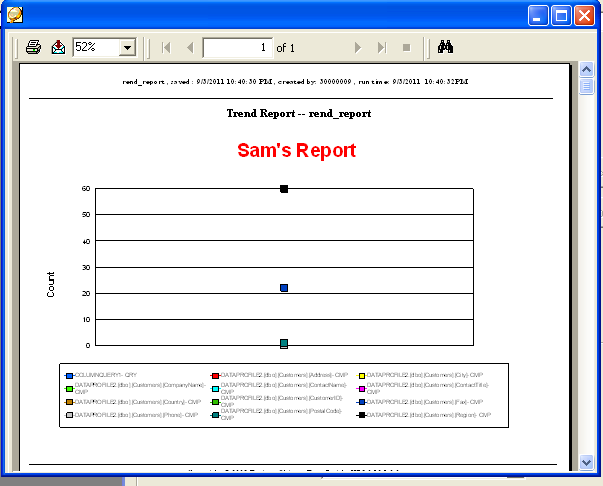
Creating a Trend Report
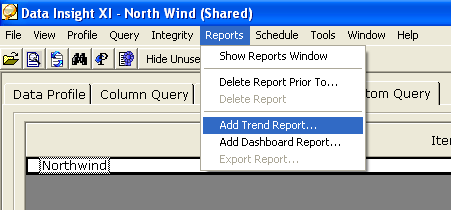
To create a trend report, select Reports → Add Trend report.
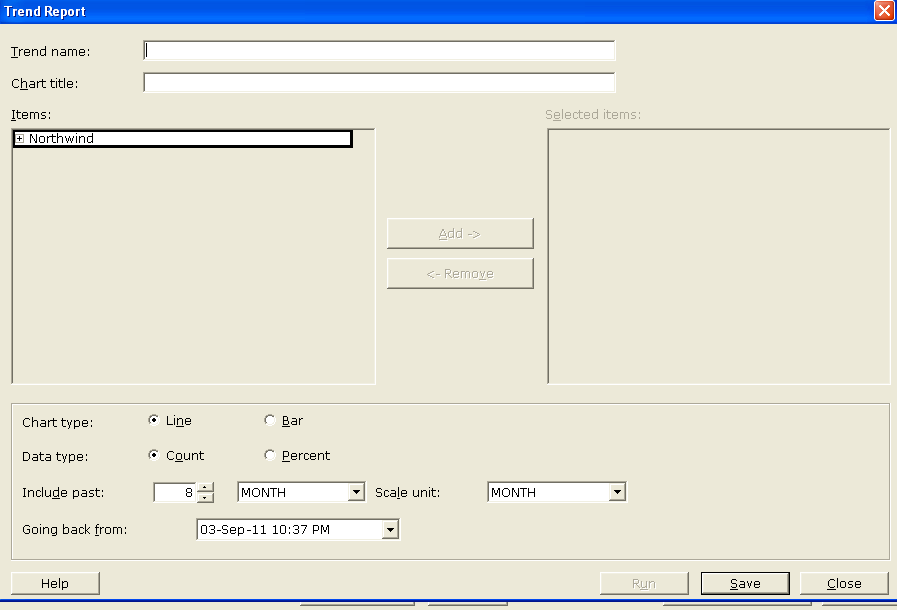
Give The Trend Name and Chart title.
Expand the data base and select test on which you want to create a trend report and click on ADD→.
Select the Chart type and data type.You can also include to choose Include past data and scaling unit.
Select the Chart type and data type.You can also include to choose Include past data and scaling unit.
Now click on save and Run.
This concludes the Profiling using data Insight.